Showing posts with label Silver. Show all posts

Wednesday, December 29, 2010

Keep tracking it

Hi,

It's almost the end of 2010 and Silver is hot...very hot. The last short term bull move is being developed after yesterday's push up.

Technicals are pointing up and MACD is almost in positive territory. I consider this event to be very important for the next few days. It may mark a healthy bull move if goes positive; if not, it will be a failed one.

Nevertheless, I'm relying mostly on my trend following model:


The current stop trigger is at 28.58. Keep this value close to you and use it to profit with it.


Thursday, November 4, 2010

Feels good to have a trend follower

Trend following on silver means happiness :)


The SLV ETF has risen another 9.65% after the last buy trigger from last week. And this was after rising 29% after the 24th's August buy signal.

Now, the trend follower is at 24.40, so keep this number in mind, just in case...

Thursday, October 28, 2010

Time to buy silver again!

Hi,

SLV closed today at 29.43 and triggered a new buy signal. The new sell trigger is positioned at 22.60.


Technically speaking, the SLV chart isn't yet so good as the trend follower points. I see the stochastic near a buy cross, so care must be taken. The RSI shows no negative divergence, which is a very good thing. The MACD has also inverted its course and is now rising again.

Tomorrow will be an important day in order to see if the uptrend is back again.

Take care,
JAPO.

Sunday, October 24, 2010

A glimpse on SLV

SLV (silver) is currently trading in a correction mood. The prices are sitting at the midle line of the standard bollinger band and, for me, this can act as a nice support fot the correction. If it doesn't, then it will probably drop to the lower line of that bollinger band.

The trend follower is now at 23,34. You know the drill...a daily close above this value is a BUY trigger.

Here is the picture:


The weekly chart is showing some will to correct more, but let's wait first for the next week's close.


Take care,
JAPO.

Wednesday, October 6, 2010

22,69 must mean something :P

Hi,

The SLV ETF ended today's session trading at 22,69...this has to mean something :P

The current chart doesn't say anything besides what I'm about to tell you:

1. Short term indicators are (really) overbought!...this is a condition that can last somedays though...
2. RSI is showing negative divergence. This means a pullback is comming soon..
3. Our trend follower stop limit was updated today to the 22.01 level, so keep this value close to you, cause will allow you to buy again at a lower price.


Tuesday, October 5, 2010

Do you wanna know what a wall of worries is?..

...Then you should take a look at the next chart:


After silver reached new all time highs, now sky is basically the limit! But...take care, negative divergences
are appearing in the daily chart and this may lead to a correction. Luckily we have a trend follower that will
warn us when one may sell. Current trend follower SLV's stop limit value is set at 21,59. Below this value one may think about selling silver, just to have some caution. Then a new buy value will be calculated...


Have fun trading silver 'cause its hot!
Bye.

Monday, September 20, 2010

Silver flying high...but claiming for some time off

Hi fellows,

Silver is currently trading very strongly after the so-called breakout above the recent symmetrical triangle.

I know a picture's worth a thousand words, but I'm really without the patience to be posting charts here...so allow me to stick with just words :)

Today the SLV closed flat at 20.29 after trading between 20.26 and 20.51. The all time high on the SLV chart is yet positioned at 20.73! We only need some miserable 0.22 points to reach that high from March 2008. My guess is that this will be a tough battle for bulls, because after today's close we may see a sell signal for some profits booking. My trend follower will trigger a sell at 20.02 so be prepared for that...

From a medium term look, silver may trade higher for quite some time...right now the technicals "smell" really good for bulls :)


Sunday, September 12, 2010

Silver and EUR/USD

Hi fellows. Long time no see!

In the last few months I haven't been in the mood for blogging, but now I hope I'm back for good :)
Let's start with silver chart (as usual through the SLV ETF) and then comment the EUR/USD. This last one is very important for SLV traders from Europe, because its action can leverage or f*** our trades.


From 13th May's top silver started some kind of triangle pattern that lasted until the 24th of August. From then to now, silver (slv) broke on the upside and reached a new year high. In this week we were presented with a topping action that may lead to a slight correction of this last move.

Who thinks silver is safe now, think twice! There's a gap from 18.09 to 18.29 in the SLV chart and this tells me that more downside will come.


For the short term, I'm betting in a correction to the 18.94 line and then more upside may come (something like a 3-of-3 :P).

The EUR/USD is currently trading lower, but I see too many bears here that I'm waiting for more upside. This is bad for us, but I really think it will happen. Then we'll see if the downtrend will resume or if a new uptrend is right here.

Bye,
JAPO.

Monday, June 7, 2010

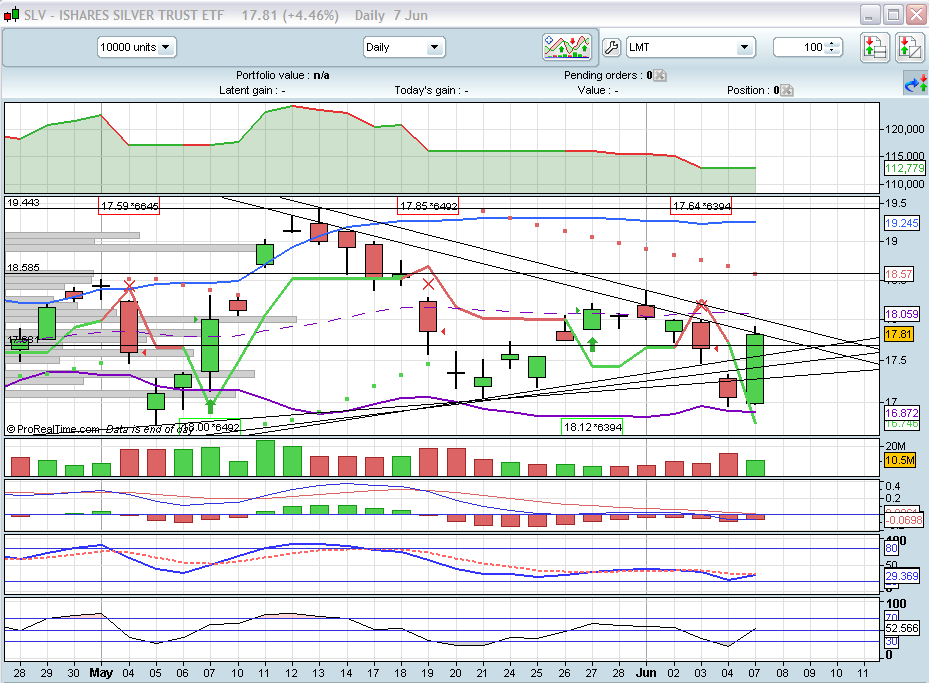
Silver: Is anyone telling me what the f$%# is happening here????

Ok guys...silver is currently in a downtrending mood...today I just won't analise this chart...I refuse to do so!!!


I will give a prize to anyone here disclosing what in the world silver is doing right now. I just gave up trying to understand. Hopefully, my follower will kick silver's ass!


Trade safely,
JAPO.

Friday, June 4, 2010

Silver is breaking

Hello,

Take a look at the SLV chart and check how it's showing some weakness:


My follower is a little bit stucked, because SLV is in a sideways mood. I'm seeing some kind of triangle and I haven't disclosed yet if it is a bullish or bearish one. I'm kind of confused with SLV's action.

After reaching new yearly highs at 19.44, SLV dropped to 17.05 in only a matter of 6 trading days! Then it went to the 18.35 level and right now it seems to be still correcting.

I'm watching very closely the 17.05 level as a support for the correction, but if that level gots broken, one may see SLV testing the 15.95 value (A=19.44-17.05=2.39; A=C=18.35-2.39=15.95).

Appart from the prices, I'm watching for the 10/11 of June from here as a target period for the end of this correction (if it really is a correction!).

Technically, all the indicators I follow are messed up. RSI, MACD and stochastics are all in sell mode, but almost oversold.


Trade safely,
JAPO

Monday, May 17, 2010

Silver: make or break

Hi fellows,

It's been long days since last update! Allow me to do a little update on silver through the SLV ETF chart that I'm stocking:


Silver hit new highs last 13th of May, but closed that day losing some points. Right now, and since that high (19.44), SLV is correcting, probably looking to close the last open gap at 18.29, but let's hope it doesn't correct that much!

I'm watching right now for the 38.2% retracement level (18,40), so I hope that today was the last day for this correction. This would be around 50% of the time of the last 6-amazing-day uptrend...

If the 38.2% doesn't hold, the 50% retracement will be the next support zone (18.1). For this week, the 18th and 19th days may be the most important ones (just a feeling like that 12th of May).

Technicals are a little bit weak, showing topping action and this is also seen in the weekly chart. But let's see how the week goes for silver...

See you soon,
JAPO.

Thursday, April 29, 2010

Market Update (SLV, INR, PSI20)

Good night!

The market today was very interesting. Generally speaking was a fine day for most markets...
Let me show my trend follower status for the SLV, INR and PSI20 chart.

1) Silver (SLV)


SLV had a nice breakthrought today, as it broke a strong resistance that was formed around the "psychologic" 18.0 level. However, nothing is already settled here, but a nice move had been made for sure! Today's volume was nice and seems to be no divergence in the RSI indicator. The stochastic oscillator is in buy mode too. The MACD grew and is almost green. In the walls of worry I see the prices touching the upper bollinger band and I'm watching how the SLV will perform until the 12th of May (there is a cross that day from two of my chart lines - call me crazy :P).

My trend follower is right now in the 17.59 level for a new sell signal.


2) India (INR)

India is my fetish market and I'm very confident that I'll be very happy in the near future with my longs!


My trend follower here is in the 12.36 level and the INR is at 12.23, so a new buy call my happen very soon. Regarding the daily indicators I see no problems for the longs and new highs are very likely.

3) PSI20


Our portuguese index has been smashed by traders in the last sessions, after the Standard and Poors rating agency dropped our rate. Just check how my trend follower caught that down move!!! It's amazing its performance :)
I'm writing today about it because, in spite of my trend follower is still in sell mode, I see nothing more than 3 clear signals for a buy call! The RSI climbed above the 30 level, the stochastic oscillator is now in buy mode and, more interestingly, there is a buy signal from the lower bollinger band! These are very reliable signals and I see no other option for the PSI20 than a short term very profitable trade!


Play your cards....I'm plying mine!

Sunday, April 25, 2010

Silver Up To Date

Hello people,

Allow me to update my silver trend follower. This week brought another trend change in my optimized follower. This time we were presented with a new buy signal, after the sell call caused by last week's sell off.

The daily chart looks like this:


For the second time in a row my trend follower acted last week as a trailing stop. However, this week provided us a new buy call and friday's candle looks pretty good in the chart. In spite the MACD is still red and the stochastic oscillator is still in a sell, the RSI has no negative divergence with the prices, so I feel like this coming week may be very good for longs (longs...not bulls! Some months ago I gave up on seeing the market as a "bull vs bears battle"...for me there's only one thing now: trend following! I don't care if prices go up or go down, as long as I can identify those moves as a trend).


The weekly chart currently also looks pretty fine for longs:


Weekly speaking, silver is rising from a MACD buy cross condition. The past has shown us that this crosses are very reliable and so the probability of success is very high right now. Who didn't buy silver yet is still on time to make a move. The stochastic oscillator is still on buy mode and the RSI, with no negative divergence, has yet some room to allow a strong move up for the next weeks. The one and only thing worrying me here is the low volume of last weeks.


That's all for today.
Trade safely!

Sunday, April 18, 2010

Let that chart speak for itself

Good afternoon,

Stocks plunged hard last friday and my trend follower caught that drop just in time. In the case of silver the new buy threshold is at 18.47, which is a level not reached since last January, so get caution!

Indicators are taking some breath right now and, if this really is a bull market, dip buyers will start to enter the market again.


Take care,
JAPO.

Monday, March 29, 2010

Silver @Buy

Good night.

My trend follower turned again into buy mode for the SLV chart. Remember the last sell at the 16.65? Well..this time you would'nt have needed to sell it. A new refreshed buy call was generated today right at the openning of the trading session (at 16.94). This means that one bought the shares at a higher level than they were sold. It happens..and I think it's still better to follow the system, because even though this time it wen't in the wrong way, when it goes in the right one it is pretty much worthwhile!

Now the chart:


The way I see it, this new buy trend has it's legs to climb up the walls of worry again. And this is because there's a new stochastic oscillator buy cross, still no negative divergence in the RSI, today's volume is OK and, finally, the MACD is almost in a bull cross.

However, nothing is still resolved and I'll be monitoring the 17.31 level in order to check if new highs are possible in the short term. I also don't like today's openning gap because...well...because it's a gap!

The new trend follower stop loss is positioned at the 16.55 level, which is a confortable value for buyers, so let's monitor this value too.

One funny thing about today's candle is that it is a perfect doji bar...completely symmetric...

Tomorrow we'll probably see some downside because the shorter term indicators are very overbought, especially the 30-minute one.

Hope I helped you with this post.
JAPO.

Sunday, March 21, 2010

Time to short silver?

Hi,

See the new short signal my trend follower issued at this friday's close:


As you can see, now the trend follower is sit at the 17.24 level, after a 2.52% drop in the SLV price last friday. The last buy call was made at the 15.00 level and the sell was at 16.65, which represents a 11% profit in 26 trading days.

Checking the other indicators and some rudimentary Elliot Wave count, I would say silver will drop a little bit before resuming the uptrend. There is a little negative divergence in the RSI and the MACD doesn't look good either, because it's hystogram is almost negative. My expectation is that silver will correct and will find support at 16.47 or 16.20 at the most. These are the levels I'll be monitoring during this week. A drop below 16.20 will be very bearish for me! Also notice the two trend lines in the chart and the prices reaching the apex...

The first sign of an hypothetic resume of the uptrend will be issued by a buy cross in the stochastic oscillator and then confirmed by my trend follower.

Just to finnish, notice how my sight right now is still bullish for silver but, in spite of that, I am following my system! I could "hold the horses" and don't sell the SLV right now. However, if I'm playing with a backtested system, I must follow it! It wouldn't make any sense to be showing you here my system and don't use it. As someone wrote in his blog, "you don't need to understand electricity to use it...you just use it!". This is exactly the way to deal with a trend follower.

Thursday, March 11, 2010

Silver

Okay...Silver is showing weakness and even some trouble supporting the bears' attempts to drop it.


Okay...those damn french gays from Marseille drawn with Benfica in Lisbon..so what? All I know is my trend follower is stocking this SLV chart very tightly.

Today SLV closed a little bit above my follower value, so tomorrow may be generated a new sell signal, because right now silver is very overbought (in spite of the new stochastic oscillator buy cross).

Weekly speaking, silver has a little more room to climb up the walls of worry, but let's have a little caution here and leave the excitement out of the equation. By the weekend I'll show you the weekly chart of silver, along with other equities.


Saturday, February 27, 2010

Metal Update :P

Good night,

Let me update my current favourite metal...Silver!

I will start with the 30 minute chart, and then comment the daily chart. Finally, I will show you the weekly chart and maybe the month if I'm in the mood. In both daily and weekly charts I keep on using the optimized trend follower parameters.


1. 30 minute chart

Here is a picture of the 30-minute chart from the Google Finance website:


As I've said in the last update (http://mytrendfollower.blogspot.com/2010/02/silver_23.html), the SLV was developing a nice support price in the 15.49 level. This was written by Tuesday's close and, as you can check in this chart, in wednesday that level hold any attempt to drop down the SLV. By Wednesday's close I was relying pretty much on the 15.49 level in order to sell the SLV if the price went down that level.

Then, in Thursday's open, the SLV openned with a gap below the 15.49. However, we got lucky and after the price came in above the lower bollinger band (that's a buy signal!), it gained more than 0.6 points in two days only.

Now, the price is topping and a small (?) correction may be in place, at least until the lower bollinger band of this chart (16.0), but the daily chart may have more intell on this issue!


2. Daily chart

Here is the picture with the daily chart and my optimized trend follower feature:


My trend follower status right now is still under a buy signal and it's threshold is about 15.6; see the last two candles...the first one is somehow a very bullish engulfing bar and the last one is another very bullish one in this context, because it's high is 16.22 and this is above the first resistance (16.20). Yes...I know....we need a bigger difference in order to aceept the 16.22 high as if it had passed the 16.20 previous resistance....

So, the resistances the SLV has to pass now are the 16.20 and the 16.47. As a dummy analyst, I would say that, if the SLV goes above the 16.50 level, new highs can be made in the medium term...some weeks further than now. Supporting any attempt to drop the SLV we have the 15.49 level in a first stage and then the 15.0 boundary. Bellow this one sell it!

Technically and in the line with my previous analysis in the blog, the SLV is in bull mode in the daily chart. The only concern here is the lower volume.


3. Weekly chart


The weekly chart is still bearish right now. My trend follower threshold here is 16.58 (vs 16.53 in the daily chart) and the next week may give us a new buy signal, if the daily chart manages to keep on bullish mode. However, I wouldn't be honest if I wouldn't express here my bearish view in this last chart.

The weekly indicators are still weak:

 .MACD histogram is still red, but inverting for the last 3 weeks: bearish/bullish
 .RSI is still below 50 and showing no positive divergences yet: bearish
 .Stochastic Osc: endend this week with a (small) sell cross: bearish
 .Volume: falling with rising prices: bearish
.BB: prices are rising from a buy call, since they rised above the lower bollinger band: bullish
 .Last candle is a "hammered green doji". Hammers are bullish, but the doji part of it shows some indecision. If had only this thing to play with, I guess I would consider this bullish.

Let me say something about the stochastic oscillator. I think this is one of the best indicators for traders who try to follow swings and trends. However, the problem is that many platforms use different formulas for its calculation and it get's tricky to trade with it sometimes. My point is that, although in this platform the stochastic issued a sell cross, in stockcharts.com and others I see a very bullish cross in the weekly chart of SLV.


Don't forget that Silver and Gold are very related to the Dollar in a reverse proportion. They act as a shelter for Dollar devaluation. So, in order for us to keep seeing a bullish undertone in these metals, the Dollar must continue its devaluation. In the UUP chart, my trend follower is in bull mode, both in the daily and the weekly chart. However, I think a top in both is being formed.


Trade safely.

Tuesday, February 23, 2010

Silver

Good night.

Take a look at this 60 minute chart:


As I told you yesterday, silver was showing some weakness and behaving like a top (major or minor...I don't care...the follower will track in the right direction).

Today has been a tough day for silver an that evidence is clear on the 60-minute chart. For 3 times it has hit the 15.49 boudary. This may be becoming a strong resistance for silver, as it is also the breakout value of 16 of February! If silver is yet in bull mode, this value will hold every down move from here. However, if the 15.49 value gets broken this week...well...silver gets in trouble!

Let me check the technicals in the chart in order to realise what may be the most likely and reliable direction for tomorrow in silver:

1. MACD: last 2 divergence bars are bullish
2. RSI: 23...below 30 (bearish), but oversold. A break on the upside from 30 would be bullish, however needs confirmation, because there's still no positive divergence
3. Stochastic Osc: oversold below 20, already with bullish cross...however needs to rise over 20 to be really   bullish!
4. BB: sideways from lower bollinger band, needing an uptrend to confirm the buy signal


I'm looking very carefully for this week's evolution in silver...this may be the most important week in silver for 2010 and mark very clearly the next medium/long trend...if resumes the uptrend or confirms the start of a downtrend.


Trade safely,
JAPO.

Wednesday, February 17, 2010

Silver

Good night!

In the past few days I've been trying to optimize my trend follower to some charts I'm following. SLV is the first one optimized and running. Basically, I took my follower algorithm and optimized the two main parameters for the backtest done in the chart's history.

Why optimizing?

I think that each equity has its intrinsic characteristics and dynamics. So, if instead of having only one trading system for all equities, I had a bunch of customized followers?
I'm not quite sure yet if this assumption is true or just a phalacy, but I am testing it. The first chart I choosed to show you is the SLV (silver ETF).

Please see.the SLV daily chart with default follower parameters:


Take a look at the backtest results. It starts in 1 of May of 2006 and ends with today' s close. The initial capital is 50.000€ and considers 13€ of trading costs in each operation. Regarding capital management there isn't any type of stop loss, but only profit reinvesment. I'm using both long and short positions (even with  long positions only, the results are quite good). The capital reached by today is 72.114€ or 44.23% profit.


Now, the chart with the optimized follower for the SLV chart:


With follower's optimization the result is by far profitable: 187.5% vs 44.23%.

This is an indication that optimization may be a very helpful tool. I have some faith here for the SLV chart, because the optimized parameters are pretty close to the default ones I'm using in the other charts. Only time will tell if this the way to trade...

As usually...trade safely!