Good night.
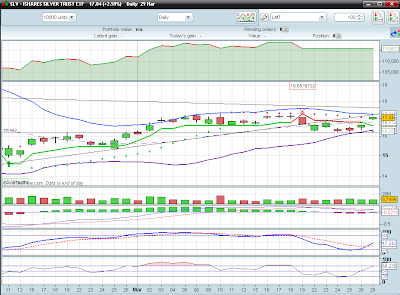
My trend follower turned again into buy mode for the SLV chart. Remember the last sell at the 16.65? Well..this time you would'nt have needed to sell it. A new refreshed buy call was generated today right at the openning of the trading session (at 16.94). This means that one bought the shares at a higher level than they were sold. It happens..and I think it's still better to follow the system, because even though this time it wen't in the wrong way, when it goes in the right one it is pretty much worthwhile!
Now the chart:
The way I see it, this new buy trend has it's legs to climb up the walls of worry again. And this is because there's a new stochastic oscillator buy cross, still no negative divergence in the RSI, today's volume is OK and, finally, the MACD is almost in a bull cross.
However, nothing is still resolved and I'll be monitoring the 17.31 level in order to check if new highs are possible in the short term. I also don't like today's openning gap because...well...because it's a gap!
The new trend follower stop loss is positioned at the 16.55 level, which is a confortable value for buyers, so let's monitor this value too.
One funny thing about today's candle is that it is a perfect doji bar...completely symmetric...
Tomorrow we'll probably see some downside because the shorter term indicators are very overbought, especially the 30-minute one.
Hope I helped you with this post.
JAPO.
Monday, March 29, 2010
Sunday, March 21, 2010
S&P 500
Now take a look at the S&P chart:
First of all, friday's bar is a bearish engulfing pattern, which usually leads to more downside. And this gets very interesting about tomorrow, because since a year ago, almost all mondays were very bullish!
My trend follower is still in buy hold mode and the treshold is at 1151. However, there's a sell cross in the stochastic oscillator and a drop below 70 in the RSI. The MACD is dropping and the there's some divergence in volume with prices.
It will be an interesting week to follow...
Time to short silver?
Hi,
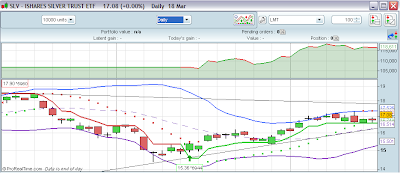
See the new short signal my trend follower issued at this friday's close:
As you can see, now the trend follower is sit at the 17.24 level, after a 2.52% drop in the SLV price last friday. The last buy call was made at the 15.00 level and the sell was at 16.65, which represents a 11% profit in 26 trading days.
Checking the other indicators and some rudimentary Elliot Wave count, I would say silver will drop a little bit before resuming the uptrend. There is a little negative divergence in the RSI and the MACD doesn't look good either, because it's hystogram is almost negative. My expectation is that silver will correct and will find support at 16.47 or 16.20 at the most. These are the levels I'll be monitoring during this week. A drop below 16.20 will be very bearish for me! Also notice the two trend lines in the chart and the prices reaching the apex...
The first sign of an hypothetic resume of the uptrend will be issued by a buy cross in the stochastic oscillator and then confirmed by my trend follower.
Just to finnish, notice how my sight right now is still bullish for silver but, in spite of that, I am following my system! I could "hold the horses" and don't sell the SLV right now. However, if I'm playing with a backtested system, I must follow it! It wouldn't make any sense to be showing you here my system and don't use it. As someone wrote in his blog, "you don't need to understand electricity to use it...you just use it!". This is exactly the way to deal with a trend follower.
Thursday, March 18, 2010
Market Update
Please see the following charts and draw your own conclusions:
1. Silver ETF SLV
2. Gold ETF GLD
3. S&P500
4. Indian MSCI ETF
5. Portuguese index PSI20
6. Russell 2000 IWM ETF
...and that's all for today folks!
1. Silver ETF SLV
2. Gold ETF GLD
3. S&P500
4. Indian MSCI ETF
5. Portuguese index PSI20
6. Russell 2000 IWM ETF
...and that's all for today folks!
Thursday, March 11, 2010
Silver
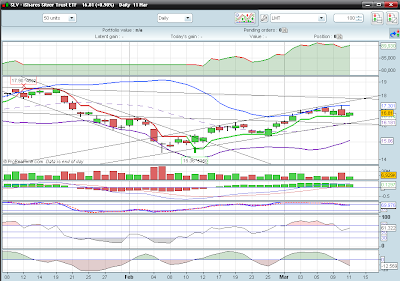
Okay...Silver is showing weakness and even some trouble supporting the bears' attempts to drop it.
Okay...those damn french gays from Marseille drawn with Benfica in Lisbon..so what? All I know is my trend follower is stocking this SLV chart very tightly.
Today SLV closed a little bit above my follower value, so tomorrow may be generated a new sell signal, because right now silver is very overbought (in spite of the new stochastic oscillator buy cross).
Weekly speaking, silver has a little more room to climb up the walls of worry, but let's have a little caution here and leave the excitement out of the equation. By the weekend I'll show you the weekly chart of silver, along with other equities.
Sunday, March 7, 2010
Dream Theater & Iron Maiden
Good night!
I wanna share with you this great news: Dream Theater and Iron Maiden will tour together in the US. The most awaited concert right now will be played at the Madison Square Garden by 12 July 2010. This a huge event and it's too bad they won't tour together in Europe too :(
Listen to this:
Dream Theater - Pull me under
Iron Maiden - Fear of the dark
Ohhhhhh Yeahhhhhhhhhhhh!
Saturday, March 6, 2010
Because it's weekend
Because it's weekend and I have some new weekly calls, I'm showing you them here.
From now on I will try to skip the words on technicals and let my trend follower model speak for itself.
See the new weekly buy signals below. A weekly signal is a long term signal, although its reliability is as good as if it were a daily signal.
1. Silver (new BUY call, either from optimized model, as from the default one)
2. S&P500 (BUY)
3. GLD (Hold)
4. India - INR (BUY)
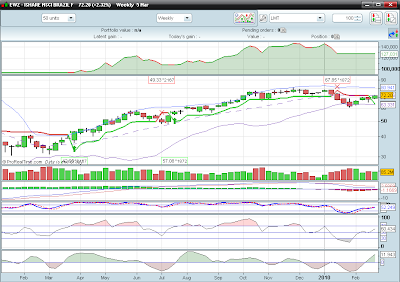
5. Brazil - EWZ (Buy)
6. Russell 2000 - IWM (BUY)
7. PSI20 (Hold)
Trade safely,
JAPO.
Tuesday, March 2, 2010
India
Now let me pleaaaase update India through the ETF I'm following (MSCI India from Lyxor).
From the weekly chart, India seems to be a little bit in the edge of a hard correction. See the picture below...In spite of my trend follower being about to be in buy mode again (weekly), I see a great bearish divergence between the prices and the RSI indicator! This usually leads to big downside!
As you can see, this divergence is huuuuuge! It begans with May/June 2009 top and continues this week. Jut for your information and in case something bad hits India, my monthly trend follower value for INR is currently 9.23. This value would be a stop boudary for long term investors in India.
Trade safely.
S&P500 Chart
Hello people,
I wanna show you how the S&P500 is doing right now, because a major turn may be hitting us again...this time maybe on the upside! Who knows me knows that when I see the long term S&P500 chart, I see it in a bullish mode, in spite of being more bearish fundamentally (things aren't so good...the recovery of the real economy is being very hard, bla bla bla).
Now let me show you the reason of tonight's post:
In a daily view we have this picture:
I wanna show you how the S&P500 is doing right now, because a major turn may be hitting us again...this time maybe on the upside! Who knows me knows that when I see the long term S&P500 chart, I see it in a bullish mode, in spite of being more bearish fundamentally (things aren't so good...the recovery of the real economy is being very hard, bla bla bla).
Now let me show you the reason of tonight's post:
As far as today's close, I'm getting a new weekly buy signal from my trend follower. This is the second one since the famous March/09 bottom and I see it as a very reliable one, if it lasts until friday's close. This is because the algorithm calculates the weekly value of the follower each day of that week, but the corresponding signal will only be valid in the last day of the week. So, we need to see a nice breakthrough this week in the S&P in order for the resume of the bullish trend. And that will only be allowed by the daily chart!
In a daily view we have this picture:
My trend follower is in buy mode since the 16th Feb close and, although another resistance has been surpassed today, some indicators are showing a small weakness. I see the RSI and the MACD with a small negative divergence and the volume looking very bad....reaaaally bad! The doji candle of today doesn't appear very well in the picture as well...I would say that (at least) a small corrective move will be done from here and the weekly trend follower won't change at the end of this week...
Trade safely,
JAPO
Subscribe to:
Posts (Atom)


