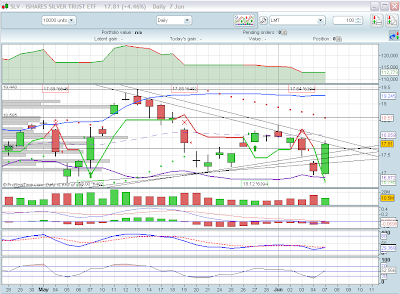
Ok guys...silver is currently in a downtrending mood...today I just won't analise this chart...I refuse to do so!!!
I will give a prize to anyone here disclosing what in the world silver is doing right now. I just gave up trying to understand. Hopefully, my follower will kick silver's ass!
Trade safely,
JAPO.
Monday, June 7, 2010
Friday, June 4, 2010
Silver is breaking
Hello,
Take a look at the SLV chart and check how it's showing some weakness:
My follower is a little bit stucked, because SLV is in a sideways mood. I'm seeing some kind of triangle and I haven't disclosed yet if it is a bullish or bearish one. I'm kind of confused with SLV's action.
After reaching new yearly highs at 19.44, SLV dropped to 17.05 in only a matter of 6 trading days! Then it went to the 18.35 level and right now it seems to be still correcting.
I'm watching very closely the 17.05 level as a support for the correction, but if that level gots broken, one may see SLV testing the 15.95 value (A=19.44-17.05=2.39; A=C=18.35-2.39=15.95).
Appart from the prices, I'm watching for the 10/11 of June from here as a target period for the end of this correction (if it really is a correction!).
Technically, all the indicators I follow are messed up. RSI, MACD and stochastics are all in sell mode, but almost oversold.
Trade safely,
JAPO
Subscribe to:
Comments (Atom)

